Understanding Canadians’ behaviour in the age of COVID-19
It’s no understatement to say that the COVID-19 pandemic has had a profound impact on Canadians’ movements in their daily lives. We are all living with business closures, stay-home advisories and physical-distancing orders. And these efforts are critical to the public health response to contain transmission of the virus and flatten the curve.
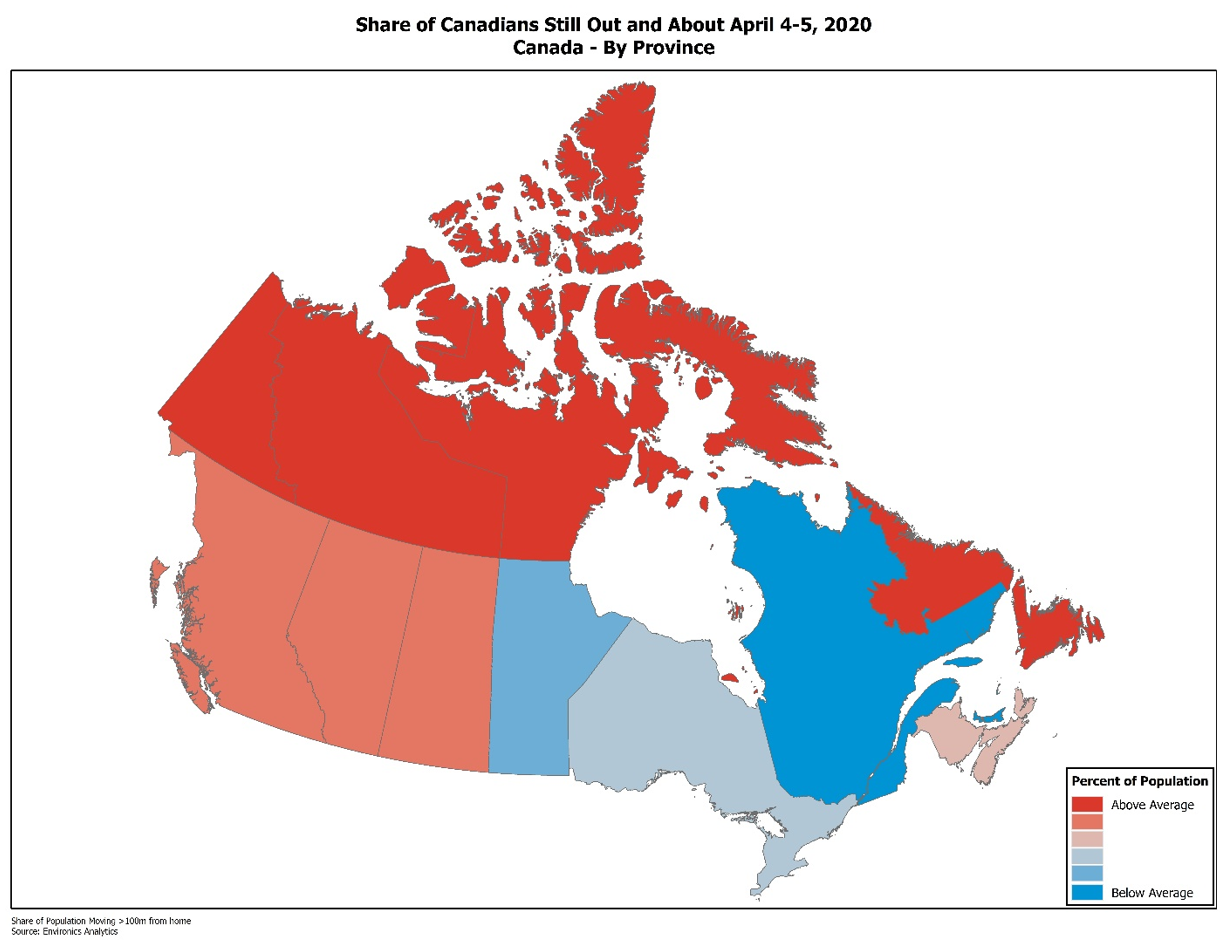
But has everyone been complying with the stay-home requests? Not surprisingly, across our diverse country, we see different rates of compliance.
Environics Analytics (EA) recently conducted an analysis of who was Out-and-About across the country as published in the Globe & Mail, Toronto Star, Winnipeg Free Press and covered on CTV.
More important than simply understanding the movement patterns of Canadians is truly understanding who these citizens are –their demographic profiles, socio-economic situations, behaviour patterns, and critically, their attitudes and values. It is this aggregation of privacy compliant data at the small geographic level that allows us to draw insights about the population that can then be used to inform public outreach, program development and communications. [Details on how we used mobile movement data and EA’s authoritative databases are provided at the end of this piece.]
So what did our analysis find about different population groups as it relates to being Out-and-About during the COVID-19 pandemic? Here is a snapshot based on EA’s PRIZM segmentation system where we compared segments that share some common characteristics but differ in their Out-and-About compliance:
1. Higher Out-and-About rates as you move away from downtown cores.
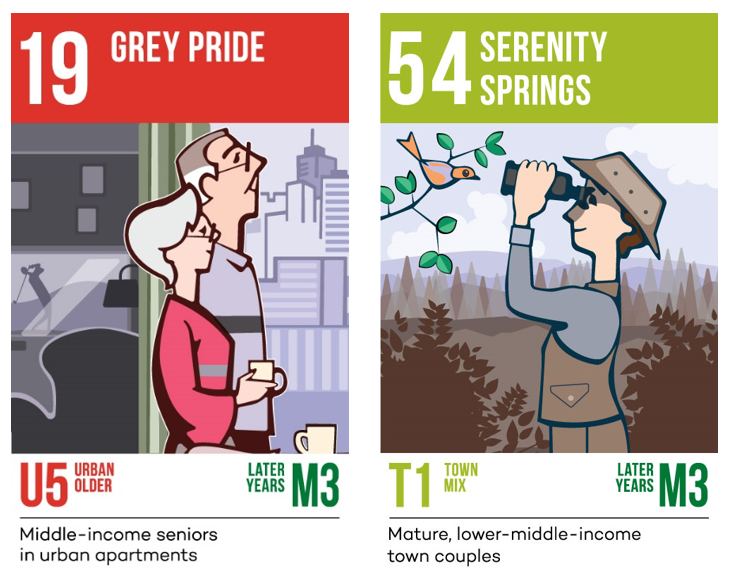
Let’s look at two PRIZM segments that contain empty nesters: one that is quite urban; the other rural. These are two older PRIZM segments (large population of 70+ years), 19 Grey Pride being a middle-class segment of retirees in urban apartments, while 54 Serenity Springs is a small-town segment of lower-middle-income retirees. Both segments are more likely to have the co-morbidities of concern for COVID-19 but the key difference between them is that 54 Serenity Springs is much more likely to be Out-and-About (15% above the Canadian average while 19 Grey Pride indexes 11% below the Canadian average). And since both segments index well below average for using social media for health-based recommendations, community-based approaches for communication are likely to be more effective.
2. Lower-income residents are out and about more.
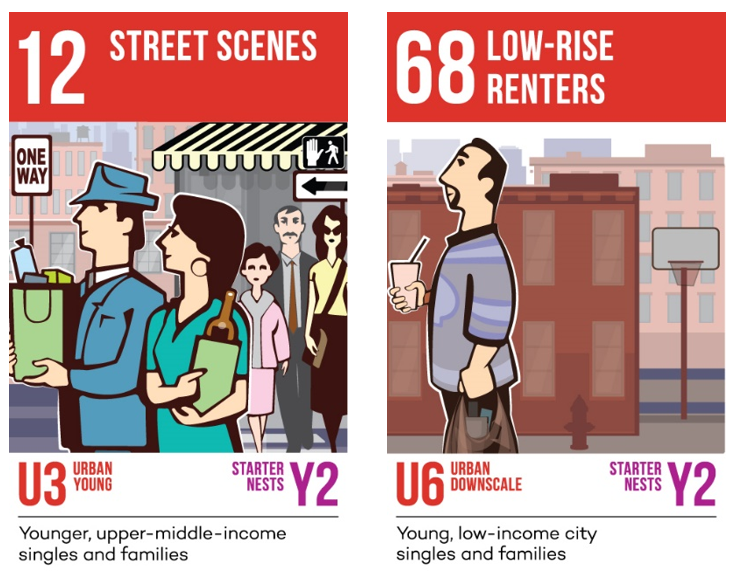
Our second example looks at two groups of downtown dwellers – living quite close together - a relatively affluent segment found in gentrifying central neighbourhoods compared with struggling apartment dwellers. Found within urban centres, sometimes not far away from each other, these two population segments are both relatively young, but at different ends of the socio-economic spectrum. Their Out-and-About rates are also different with 68 Low-Rise Renters showing rates 15% more than the Canadian average. This same segment also indexes lower than 12 Street Scenes as well as the Canadian average on the psychographic “Effort Toward Health”*, which could mean that physical distancing is taken less seriously. A better understanding of their circumstances could help reach them to ensure they know how to take precautions.
* The commitment to focus on diet, exercise and healthy living to feel better and have a healthy, wholesome lifestyle. A willingness to transform one’s lifestyle through exercise and radical changes to diet.
3. Age is not necessarily a key differentiator on Out-and-About rates.
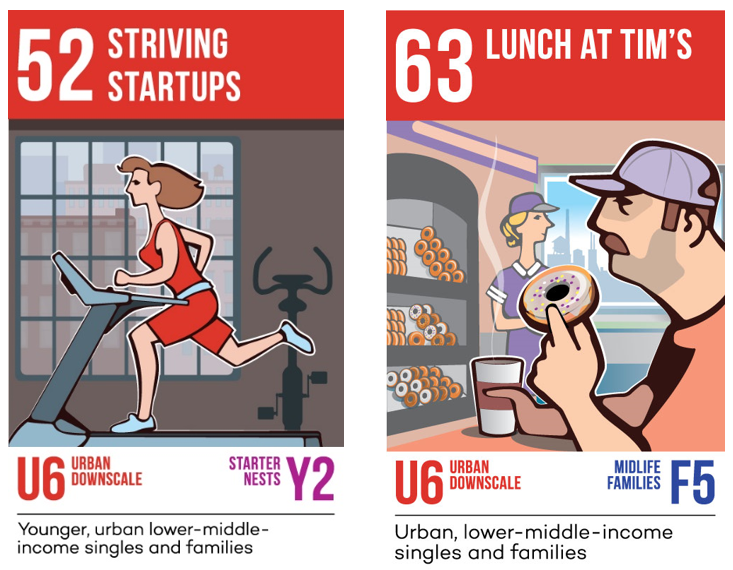
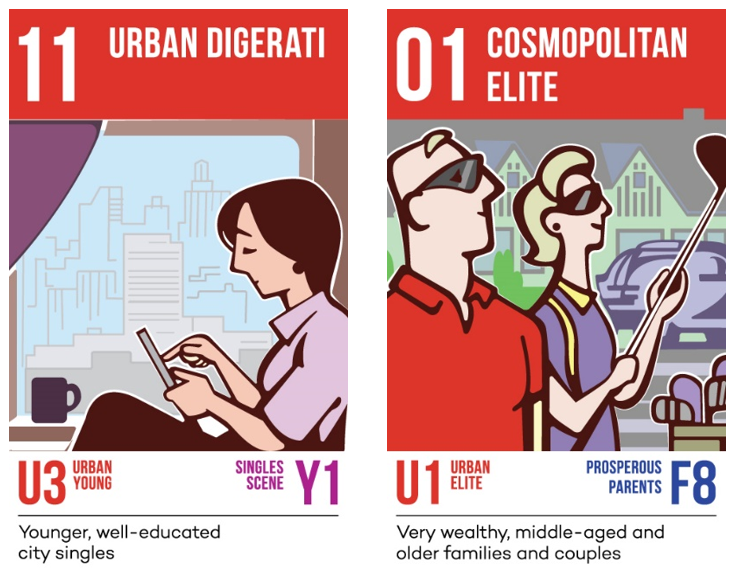
We have recently seen news reports showing young people congregating in public spaces, putting themselves and others at risk of infection. Our data indicate that urbanity and socio-economic status (discussed above in the other examples) may matter more on Out-and-About rates than age.
As examples, in the two pairs of PRIZM segments above, each pair have similar urbanity and socio-economic status but one segment in each pair is young, the other older.
Within the first pair (52 Striving Startups and 63 Lunch at Tim’s), despite the age differences, the Out-and-About rates are higher than the Canadian average (21% and 12% respectively).
In the second pair (11 Urban Digerati and 01 Cosmopolitan Elite), the segments tend to be well-educated and affluent, living in the downtowns of Canada’s largest cities. Again, despite their age differences they were both less likely to be Out-and-About than average (15% below average and 36% below average respectively).
More information on the Out-and-About rates across the country and our PRIZM-based analysis is available here.
Data-driven insights to inform COVID-19 recovery
Governments have enacted a variety of orders, legislation, guidelines and enforcement to get large numbers of people to stay home. Further improving compliance will require more nuanced strategies targeted to specific populations who cannot, or will not, stay home.
But being able to provide rapid insight into populations of interest can inform a range of additional initiatives critical to the social and economic recovery process from this pandemic. With over 30,000 indicators of behaviour and demographics for neighbourhoods across Canada (available at the 6 digit postal code), we can support government departments at all levels with efforts such as economic impact analysis, program design, the identification of target populations and the definition of media strategies for communications.
Below are several immediate and relevant use cases for these insights:
- Stay-Home Compliance Messaging by Public Health:
As identified in the analysis recently published in the Globe & Mail (referenced above), more targeted communication strategies are required to continue to improve compliance with stay-home regulations across the country and by population segment. - Essential Worker Messaging:
Local data on essential workers combined with demographics, psychographics and media preference information can help ensure these key workers are taking precautions by reaching them with the most effective messaging. - Identifying Top Congregation Points to Monitor Physical Distancing:
Privacy-compliant mobile movement data can be used to identify where people continue to gather (per recent news item on CBC) and to understand their characteristics in order to intervene proactively (e.g. targeted public health messaging). - Exposure Risk Notifications:
Consent-based, anonymized human movement data can identify more people who could have been exposed beyond those that COVID-19 apps can identify, thereby improving the effectiveness of notification efforts. - Understanding Frail, Socially Vulnerable and Financially Vulnerable Populations:
Our health, demographics and financial databases were used to create purpose-built indexes for these three populations that need support. The indexes help target program communications to those who need support, improving their efficiency and relevance.
These are just a handful of examples that demonstrate how understanding where particular citizens live, what their socio-economic situation looks like, how they behave and how they think can materially impact social and economic programs during this pandemic. And the analysis outlined above is available quickly and easily through our cloud-based ENVISION software platform, in reports, tables and charts that clearly describe catchment areas, municipalities and the characteristics of neighbourhoods.
Canadians are a diverse population, as diverse as the country is wide. We behave, think, consume and generally act differently based on thousands of attributes, including where we live. The COVID-19 pandemic has shown this to be true when it comes to compliance with movement restrictions and similar data-driven insight can be applied for additional use cases. We are proud to be using our data and analytical capabilities to assist with addressing the COVID-19 outbreak and to help flatten the curve. We will continue to do so, including helping get Canada back on the road to recovery and beyond.
Methodology Statement: EA has a privacy- compliant database called MobileScapes developed from aggregated mobile phone movement data from multiple sources. Using these data, we identified devices that were “out and about” during the daytime for weekends from early February to early April.
The measure of Out-and-About was devices that were observed more than 100 metres from their inferred home postal code at least three times for ten minutes each in a day. We chose weekend data because the largest percentage of the population would be free to choose their activities on typical non-workdays.
We aggregated the data to various geographic areas to understand the patterns at a national, provincial and market level. Next, we analyzed the results through the lens of our PRIZM segmentation system. PRIZM assigns every Canadian postal code to one of 68 lifestyle types based on demographics, socioeconomic status, diversity and psychographics. This analysis helps identify areas where the populations may not be taking the stay-home orders seriously enough and provides insights into who they are and how to motivate them.